We used tissue and cell type-specific gene expression data from the Human Protein Atlas, GTEX, Fantom, and consensus datasets
to identify ramp sequences in genes in specific tissues and cells types.
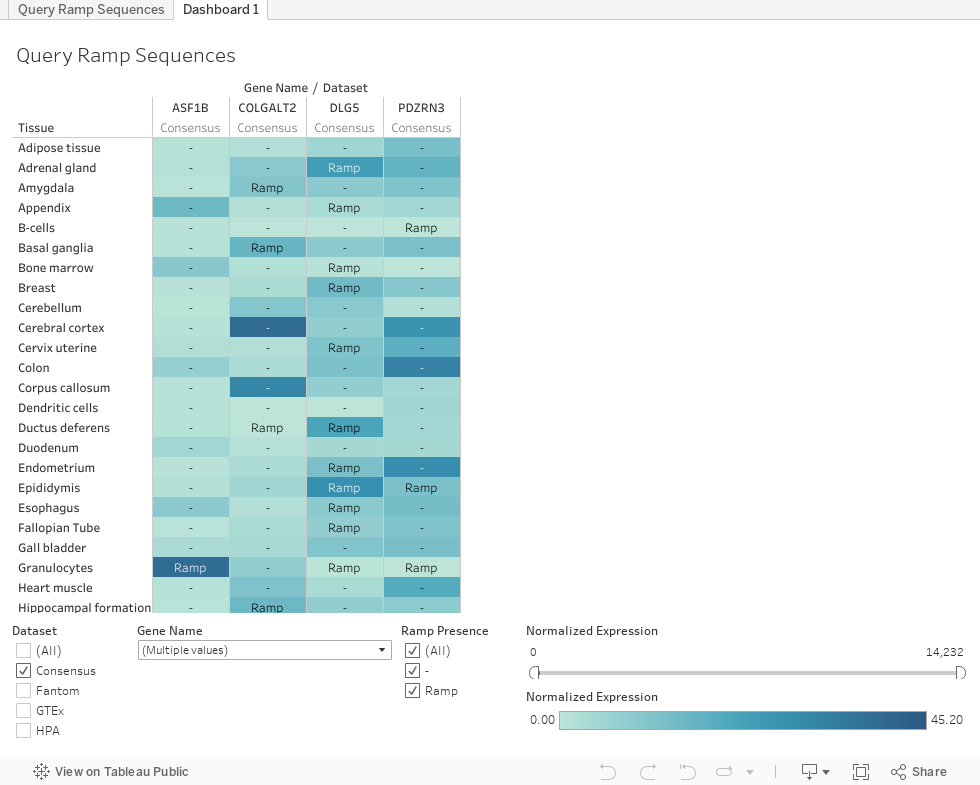
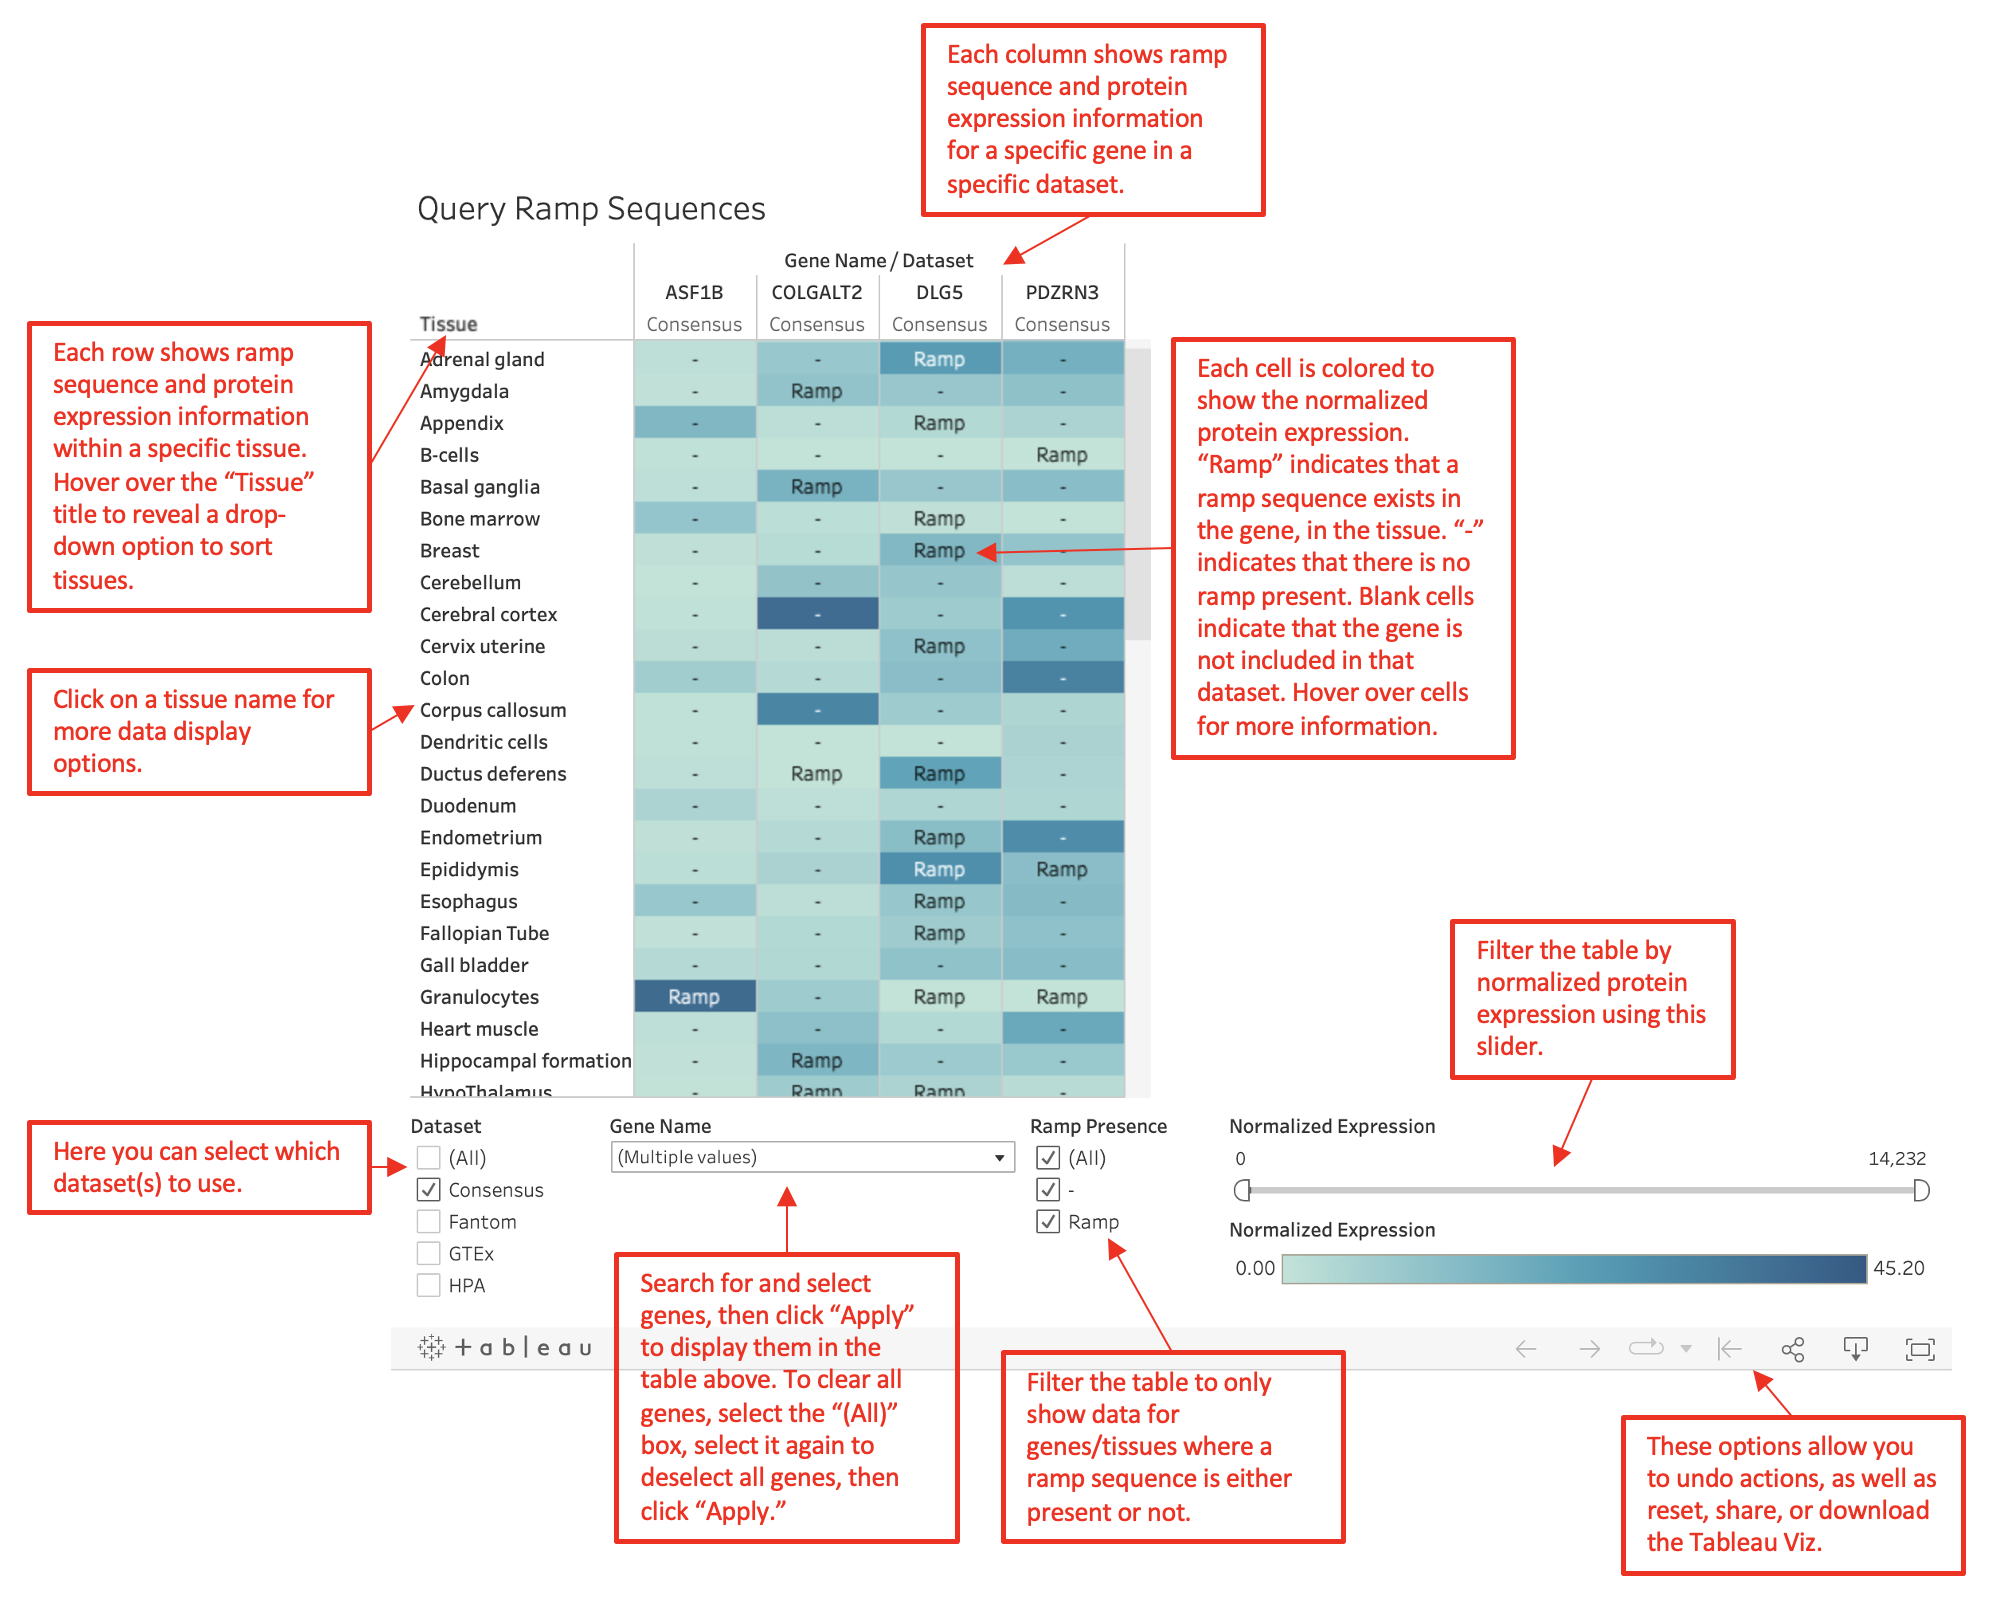
Search different genes to identify which tissues have a ramp sequence. The color of each cell
represents the normalized expression level of the gene in the tissue. A darker blue indicates higher expression.
When a tissue does not have a ramp sequence in the gene, a "-" is marked in the cell. Data can be
filtered by gene, dataset, ramp presence, and normalized expression.
To clear the currently displayed genes,
on the "Gene" filter check the "All" box, then uncheck it, and then press "Apply."
A ramp presence of
"Uncertain" indicates that the original FASTA gene sequence could not be run through the ExtRamp algorithm.
From the Human Protein Atlas website: "For each of the three transcriptomics datasets (HPA, GTEx and FANTOM5), the average TPM value of all individual
samples for each human tissue or human cell type was used to estimate the gene expression level. To be able to
combine the datasets into consensus transcript expression levels, a pipeline was set up to normalize the data
for all samples. In brief, all TPM values per sample were scaled to a sum of 1 million TPM (denoted pTPM) to
compensate for the non-coding transcripts that had been previously removed. Next, all TPM values of all the
samples within each data source (HPA human tissues, HPA blood cells, GTEx, and FANTOM5 respectively) were
TMM normalized,
followed by Pareto scaling of each gene
within each data source. Tissue data from the three
transcriptomics datasets were subsequently integrated using batch correction through the removeBatchEffect
function of R package Limma, using
the data source as a batch parameter. The blood RNA-seq dataset was not
limma-adjusted. The resulting transcript expression values, denoted Normalized Expression, were calculated
for each gene in every sample."
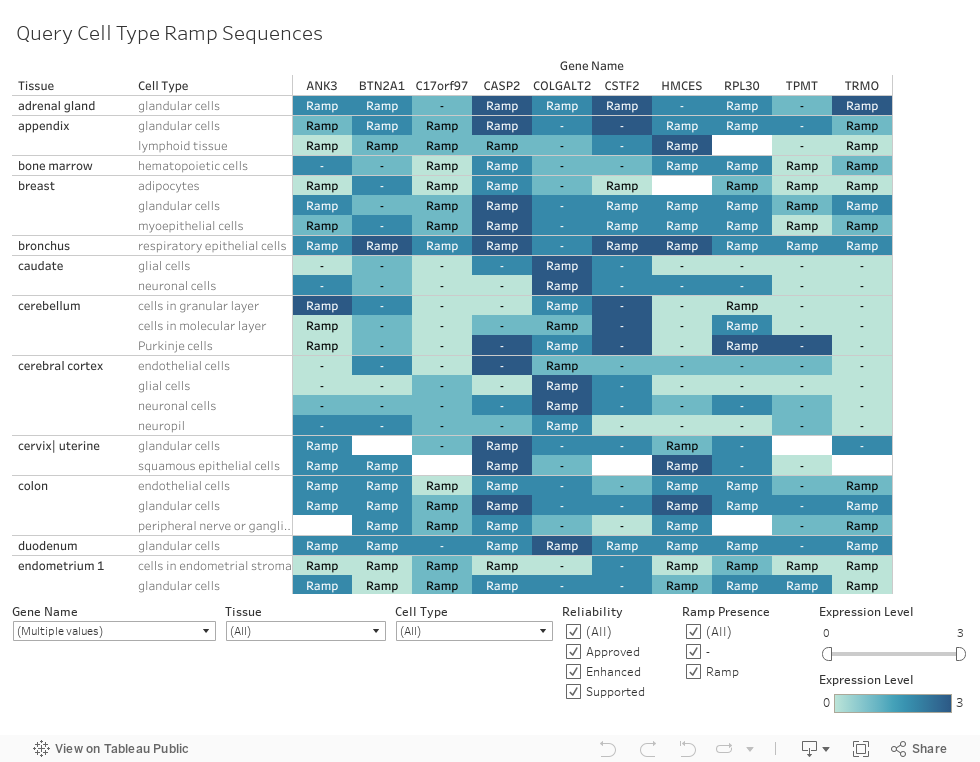
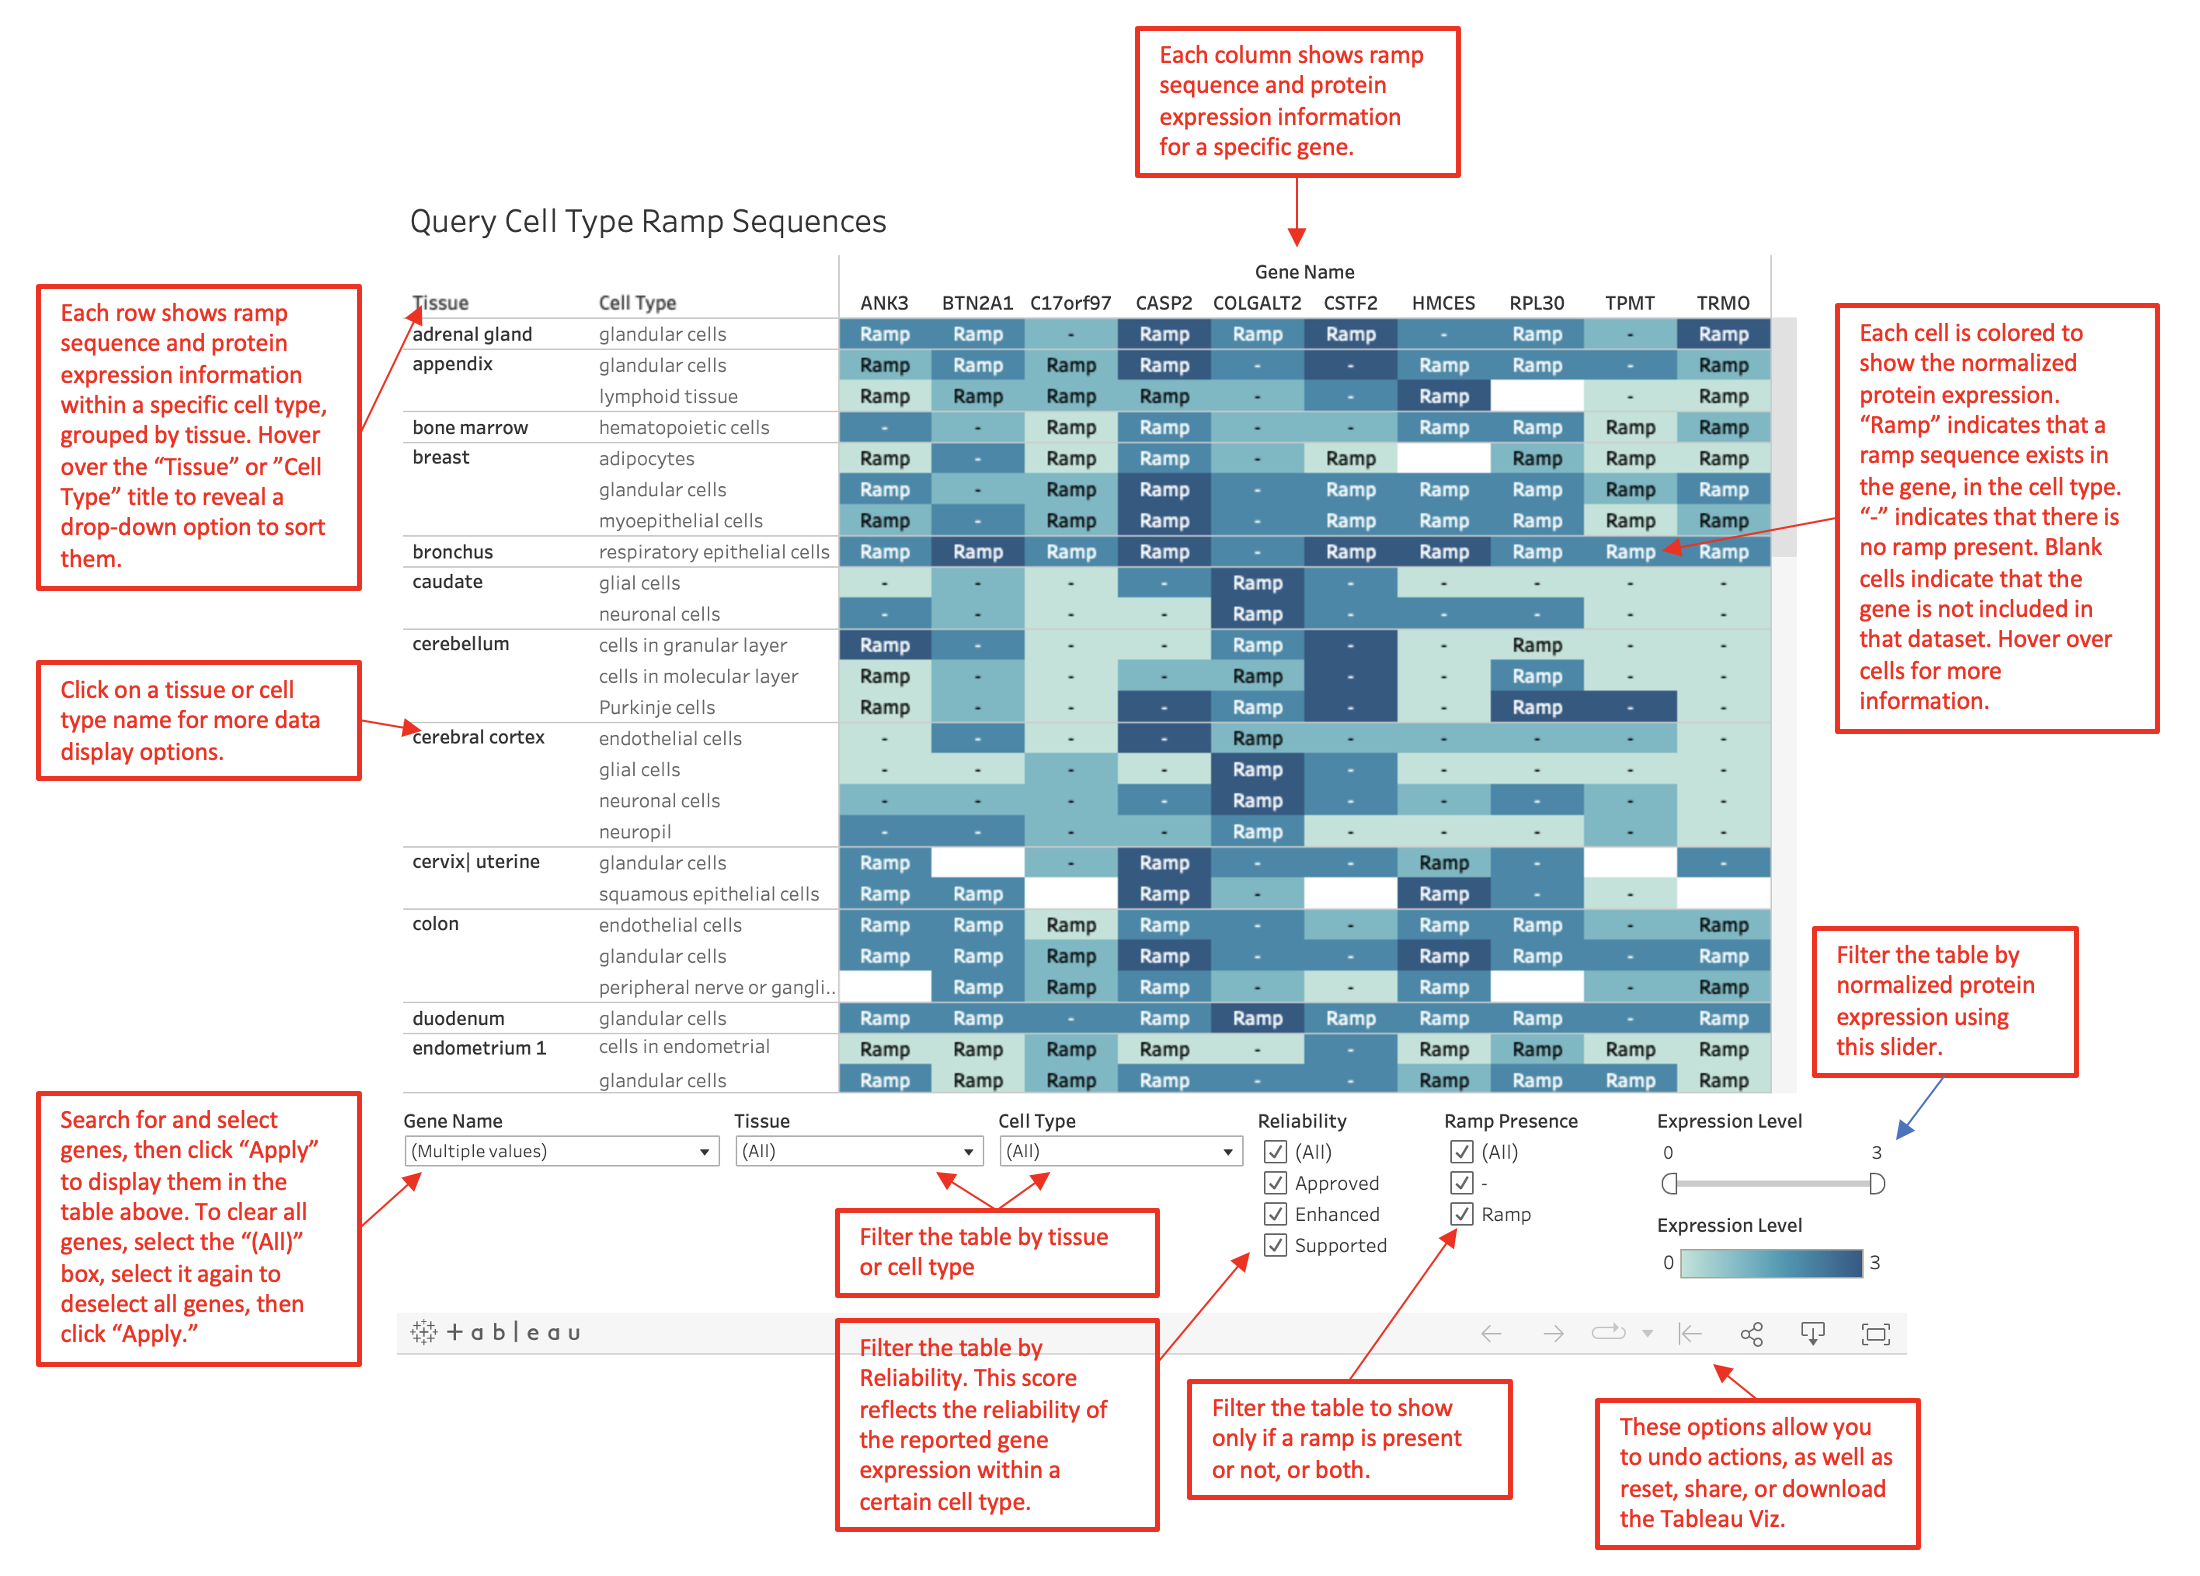
Search different genes to identify which cell types have a ramp sequence
as well as information such as gene expression level and measurement reliability.
When a cell type does not have a ramp sequence in the gene, a "-" is marked in the cell.
To clear the currently displayed genes,
on the "Gene" filter check the "All" box, then uncheck it, and then press "Apply."
Information can be filtered by gene, tissue, cell type, reliability, ramp presence, or expression level.
Expression levels have been switched from "High," "Medium,"
"Low," and "Not Detected" to 3, 2, 1, and 0 respectively to implement Tableau's color gradient feature.
Reliability scores as defined by the
Human Protein Atlas
are based on RNA expression level correlation with antibody staining, independent
antibody validation, knockdown of the target protein, matching the antibody stainings signal with
GFP-tagged proteins, and evidence from literature.
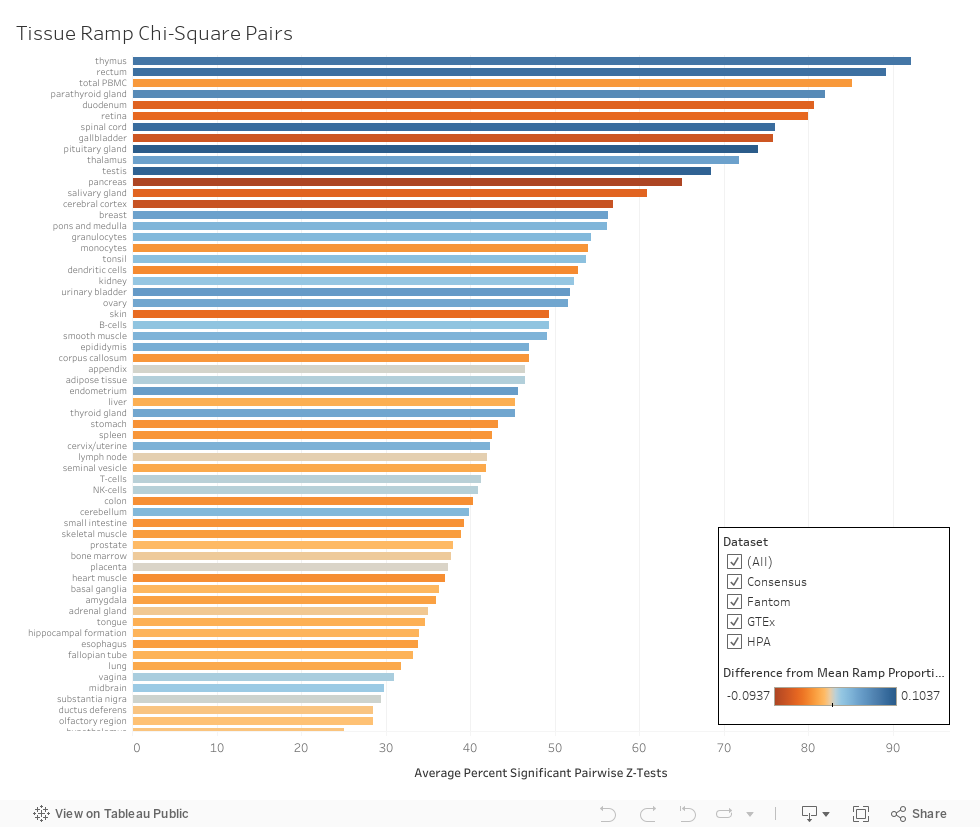
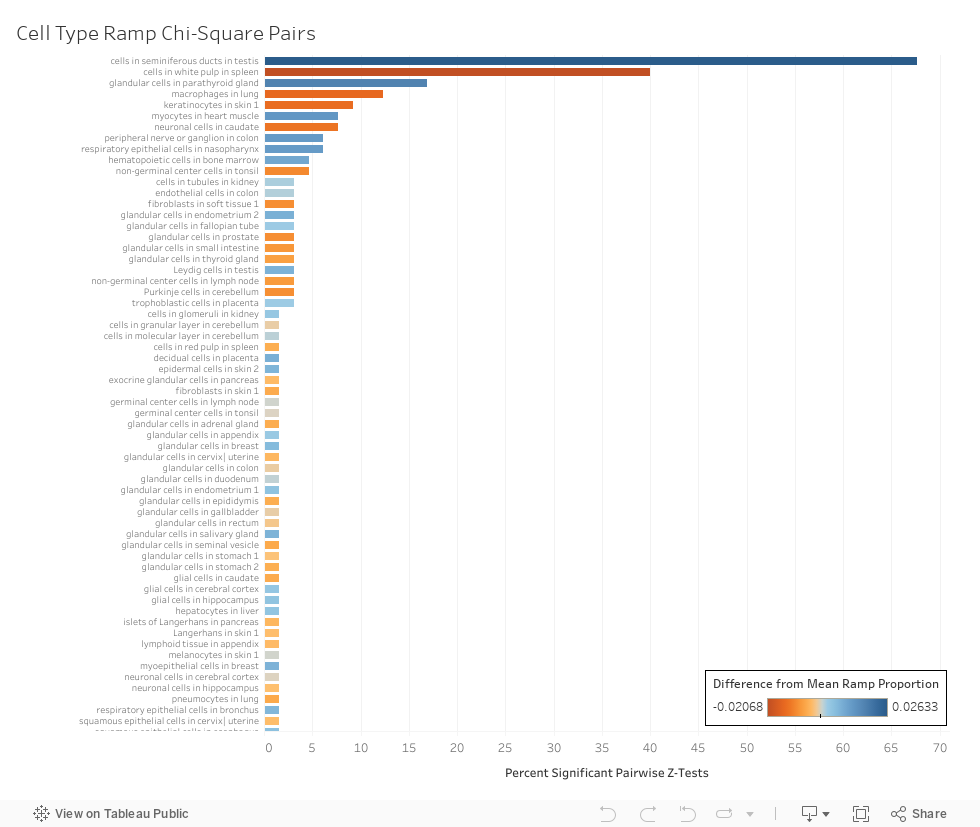
The percentage of genes present in both tissues where a ramp sequence is also in both tissue types.